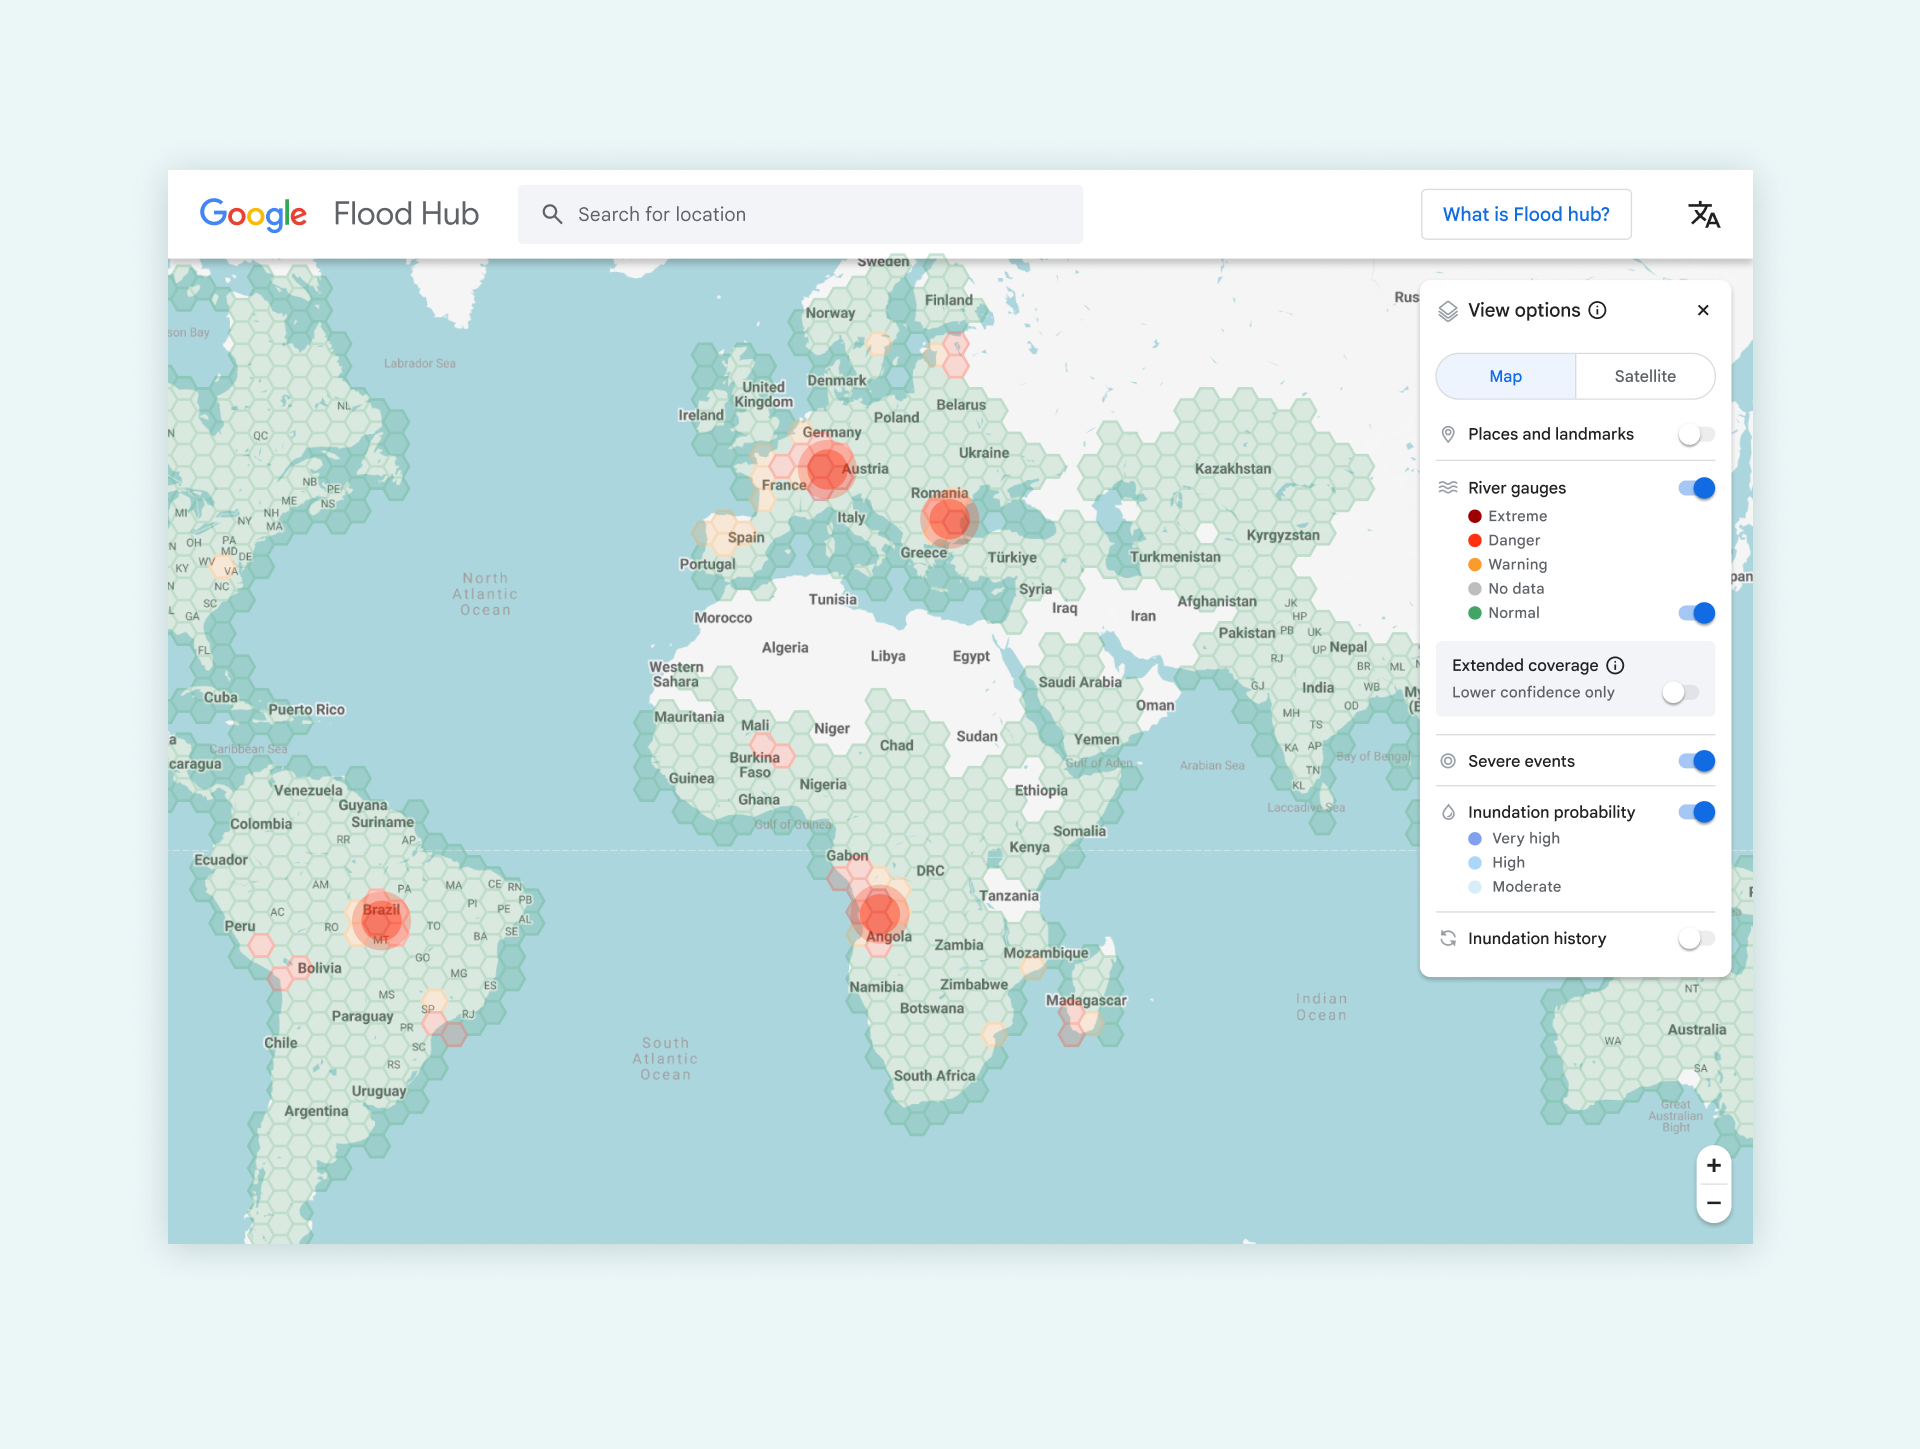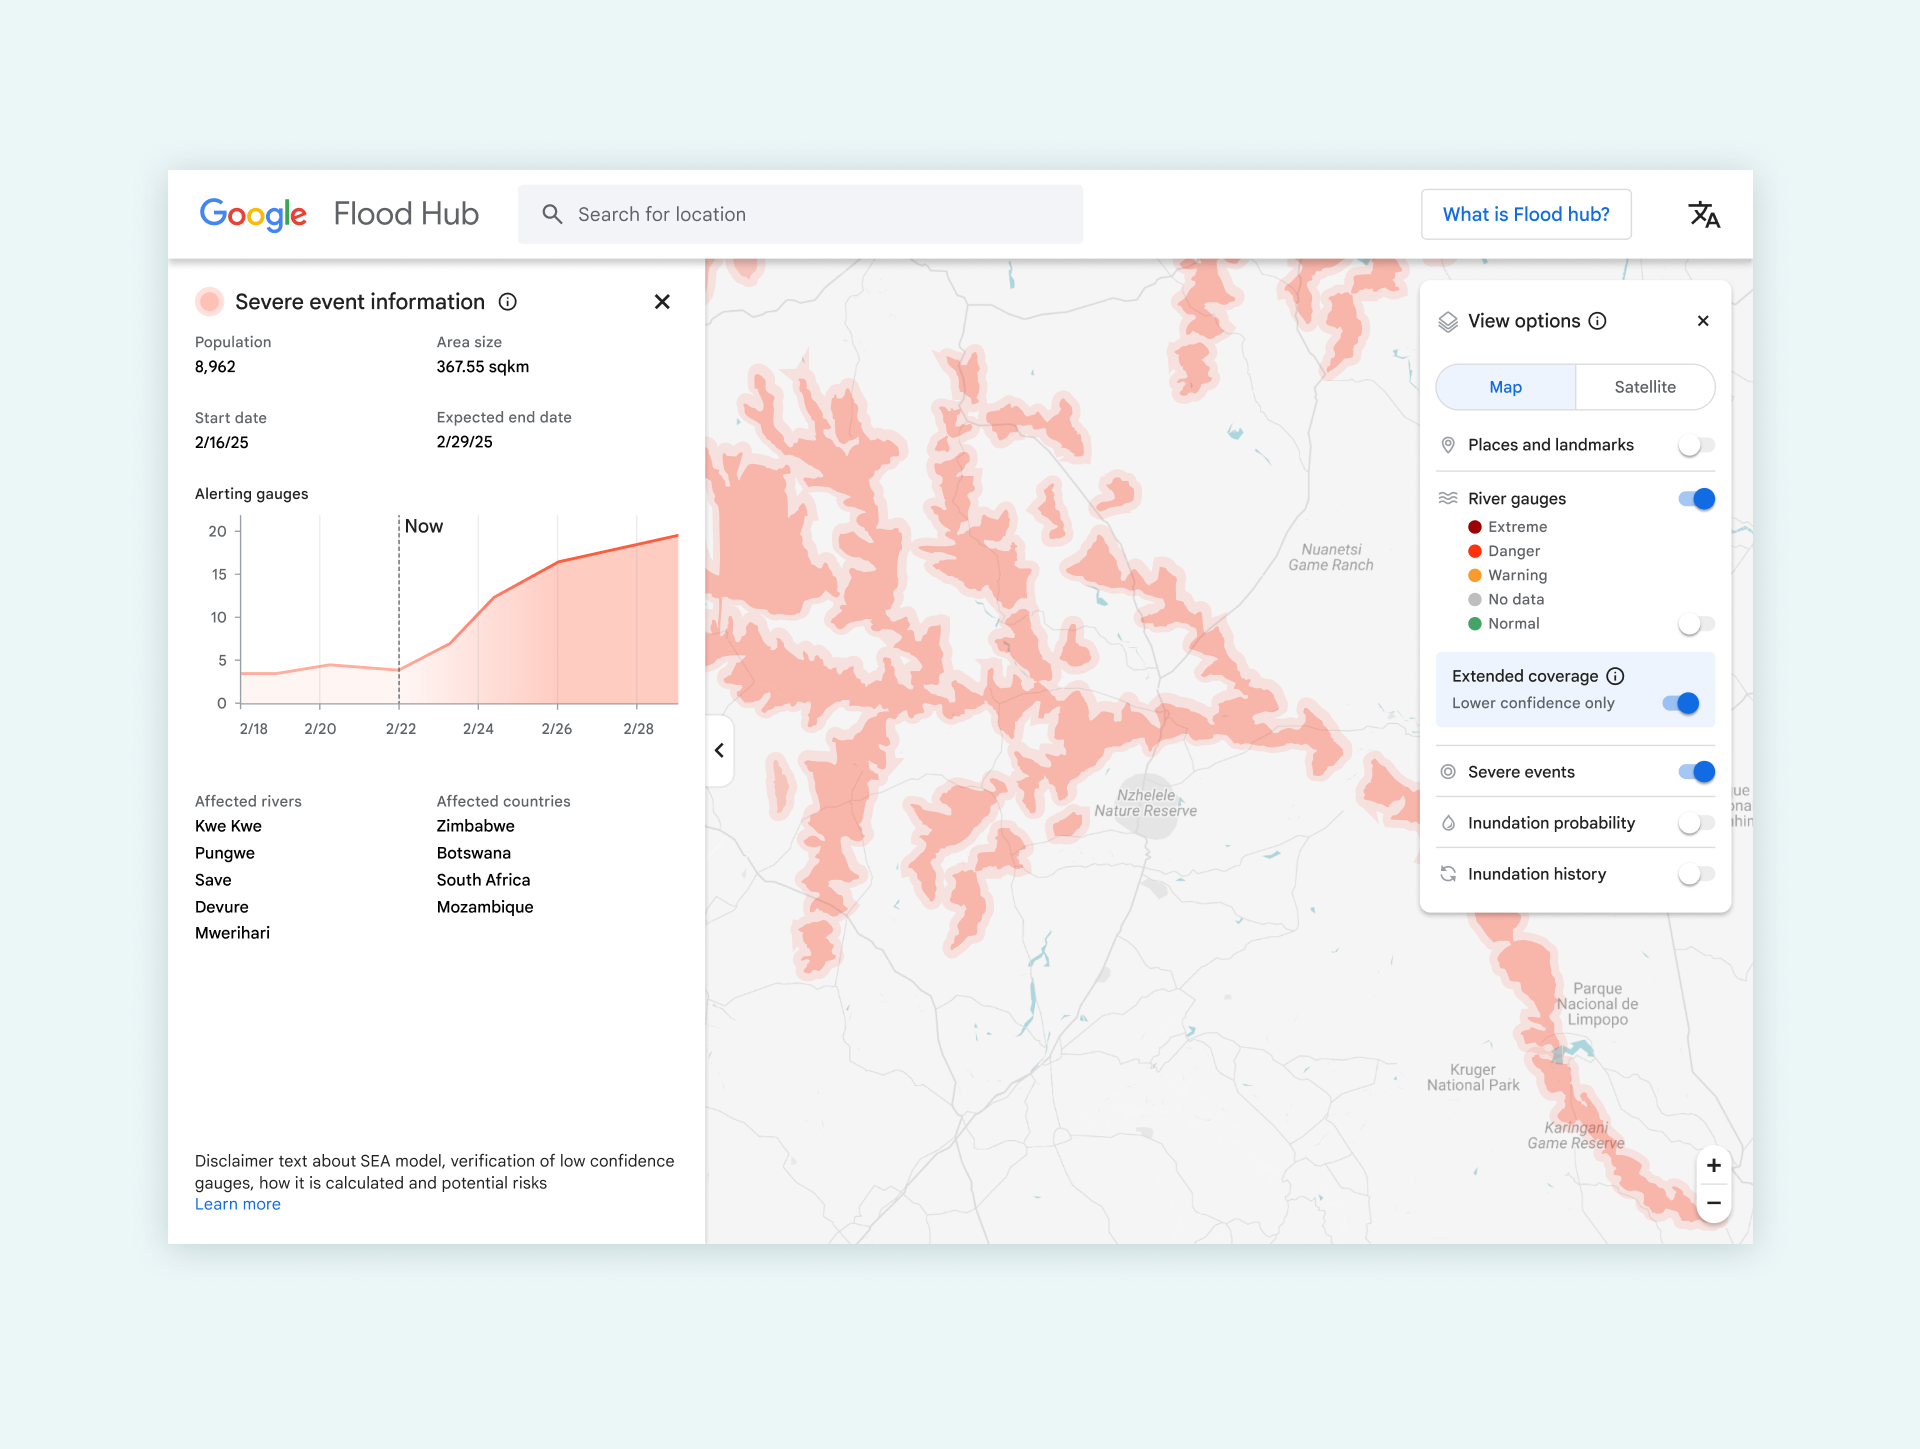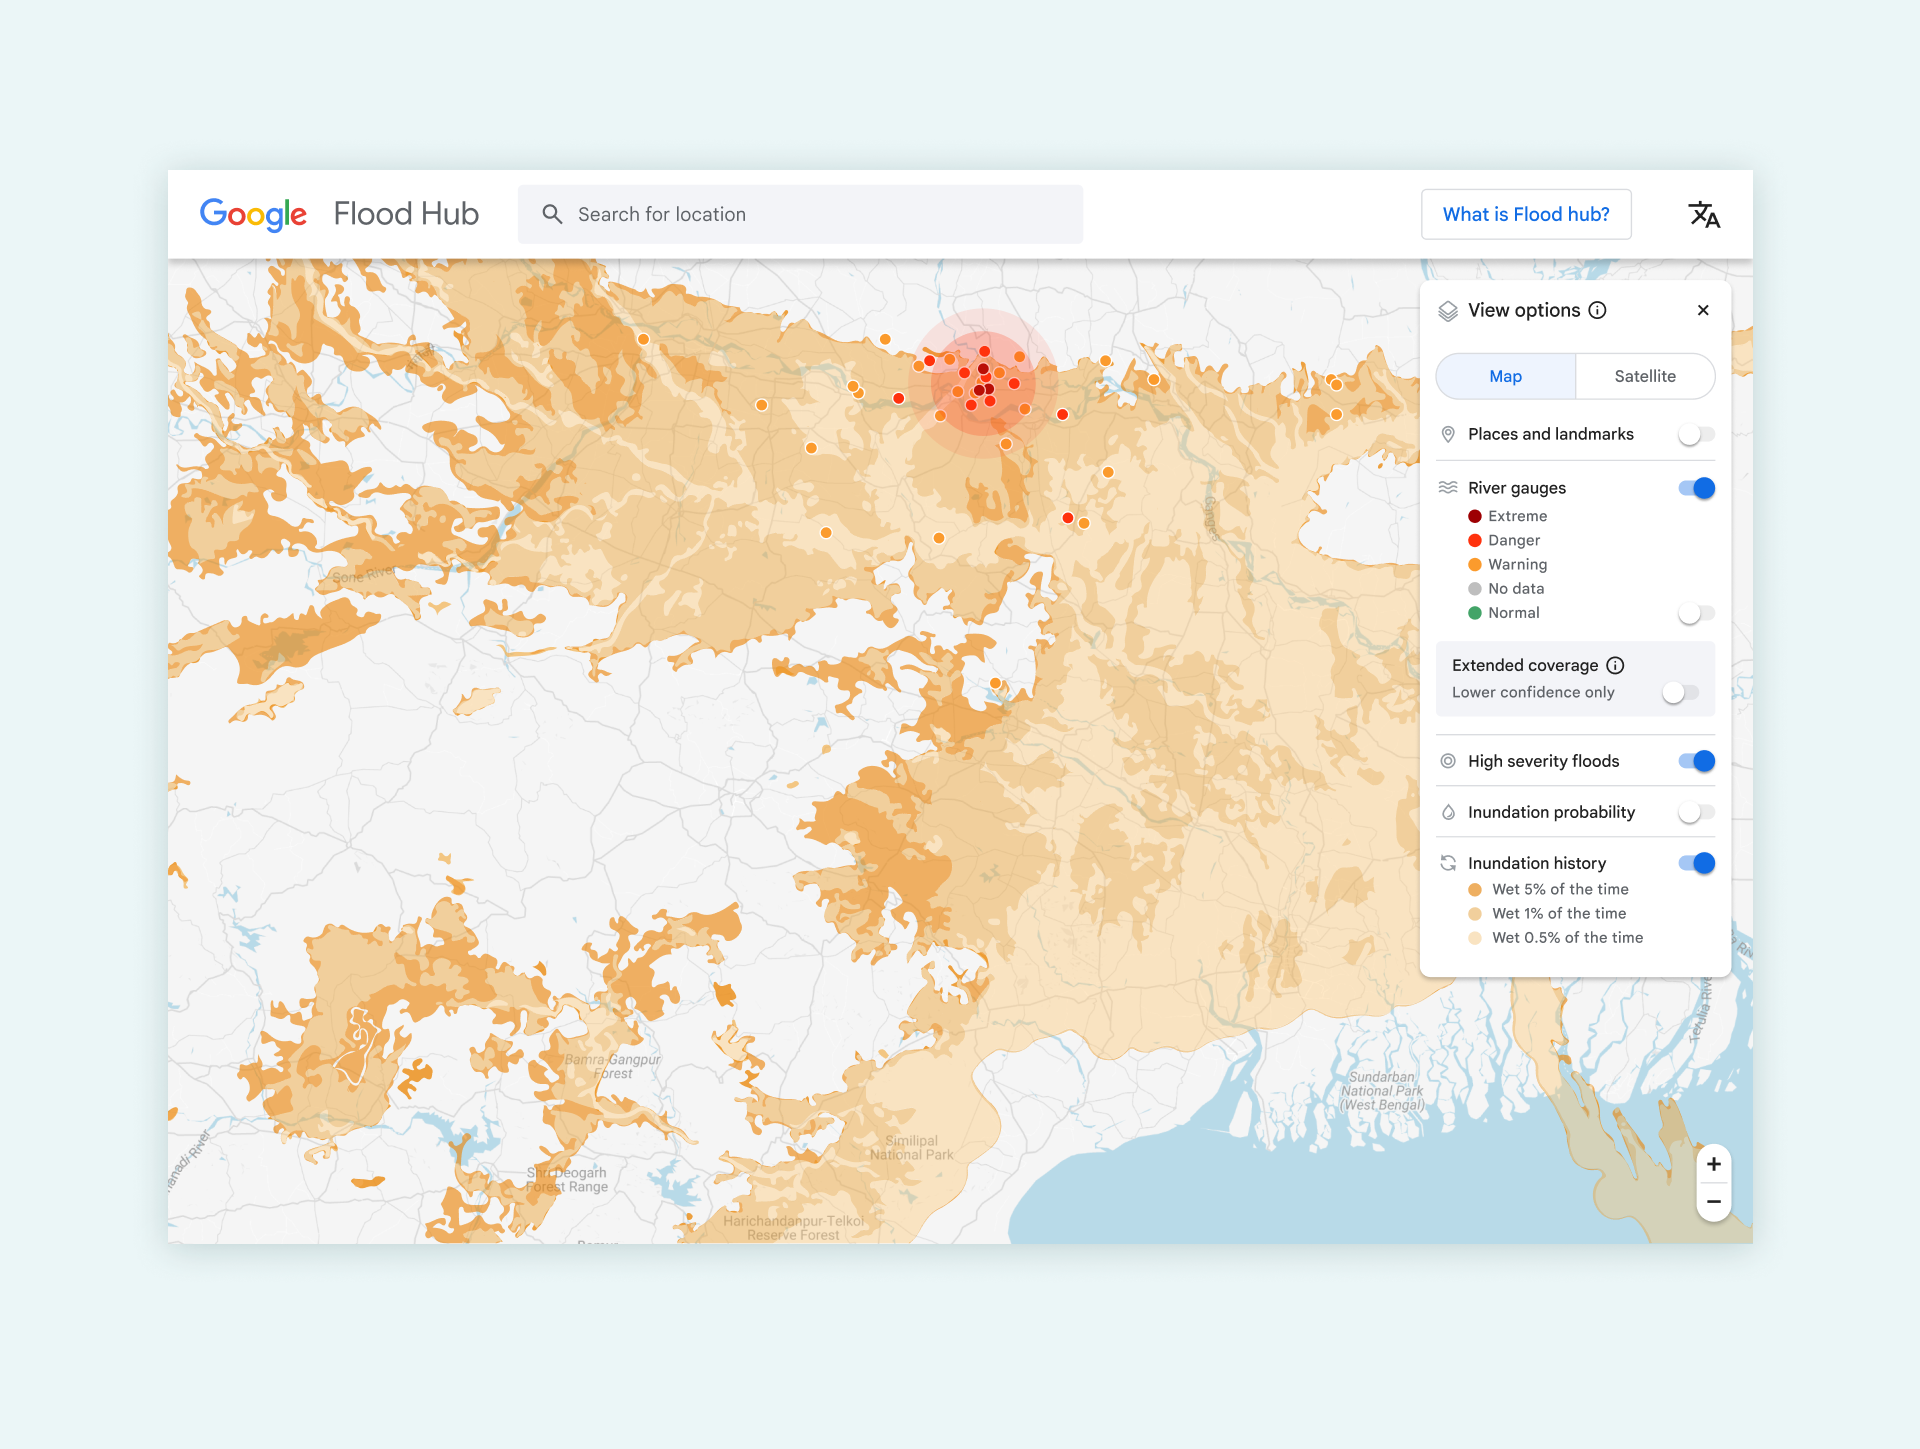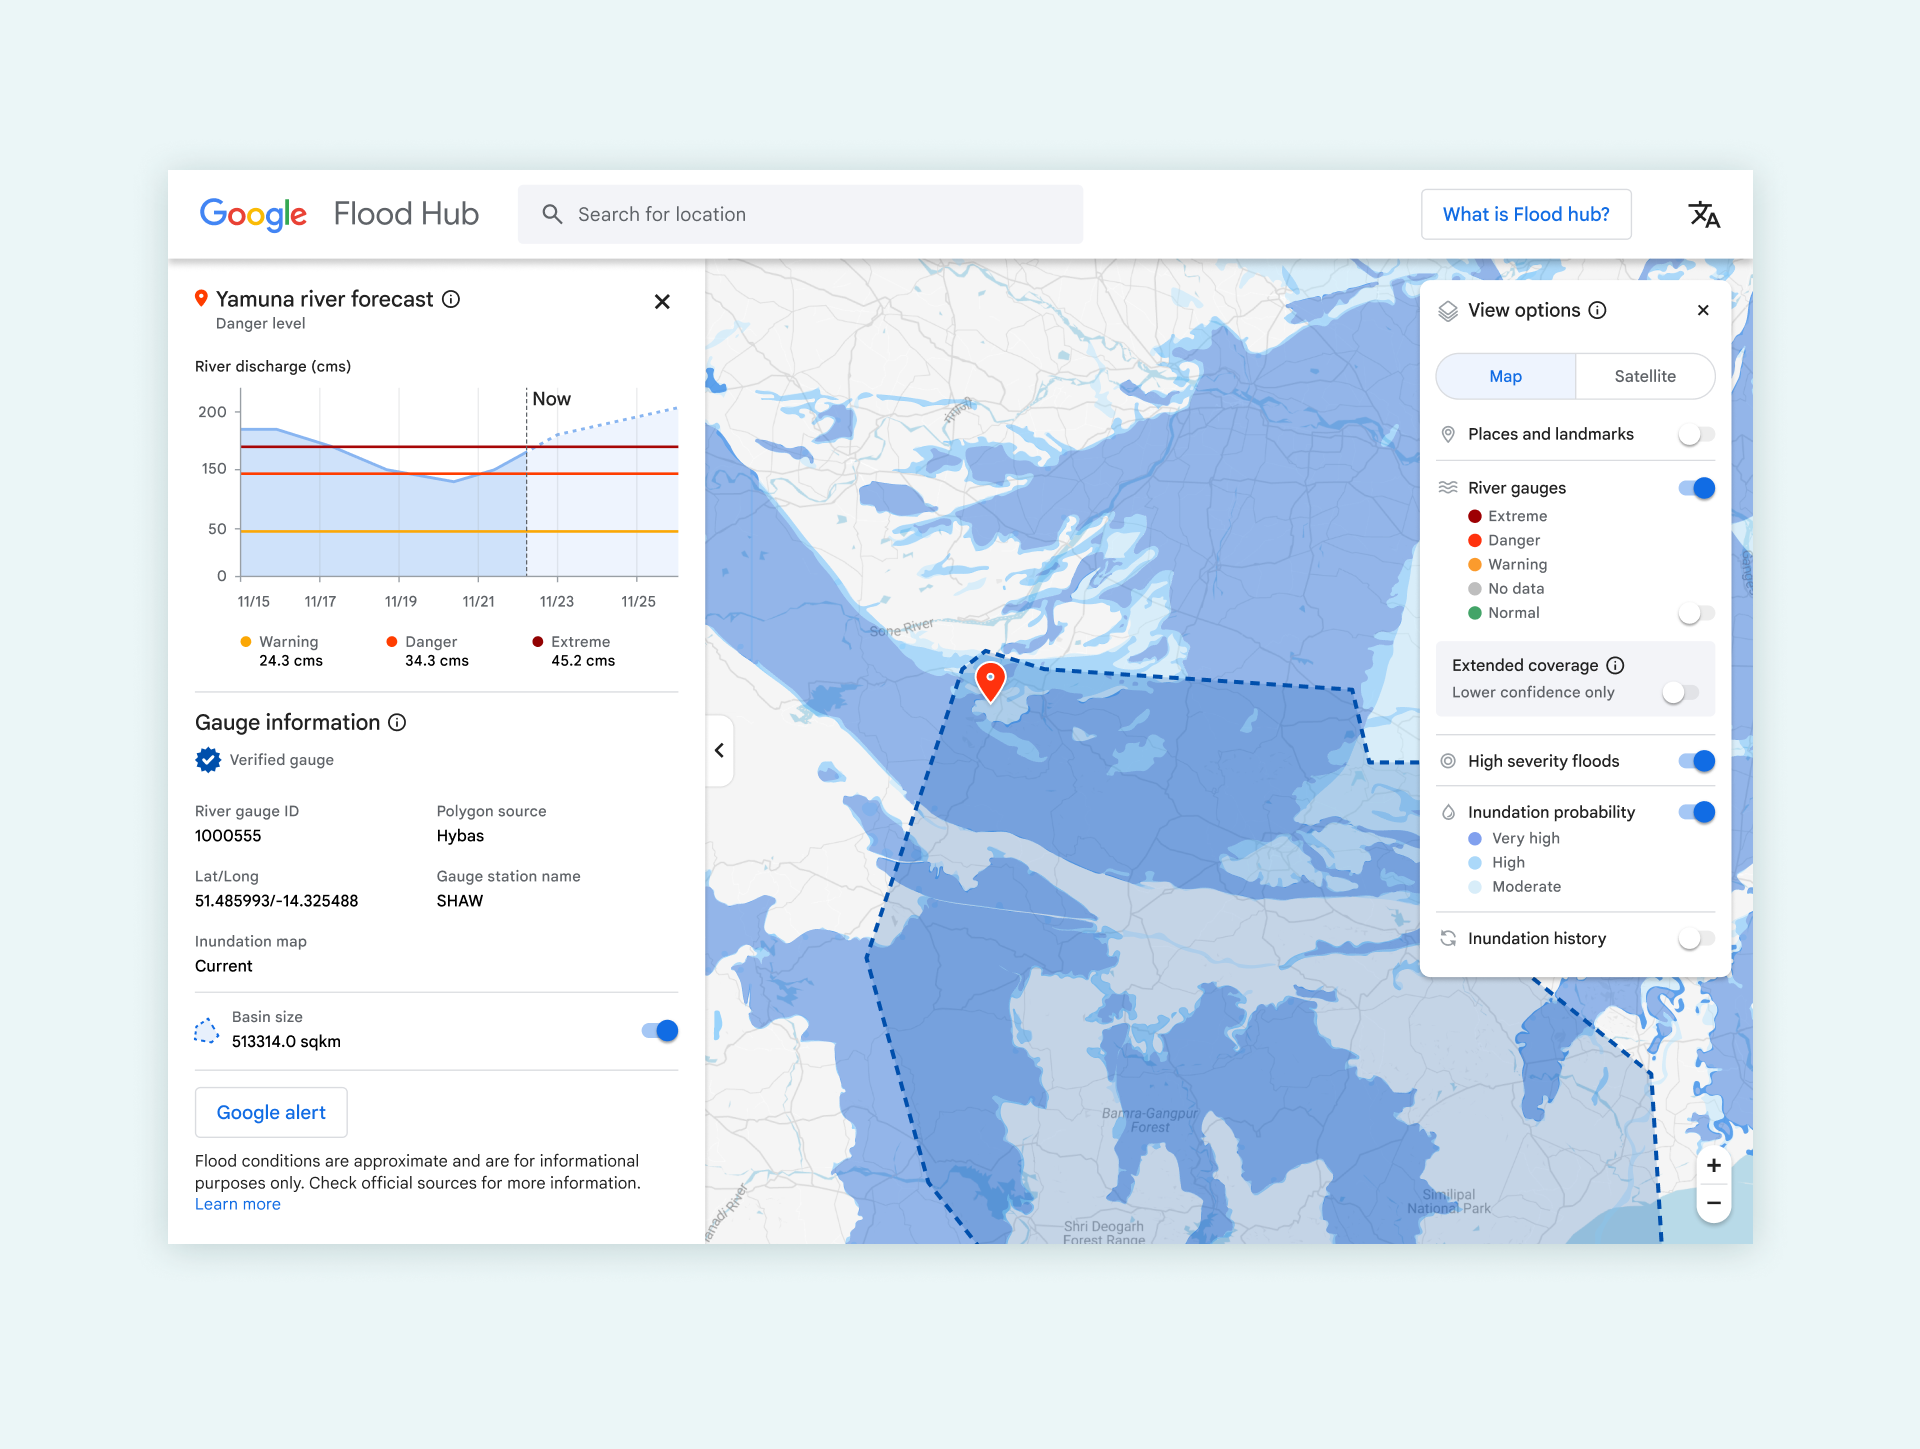
Working with the Google Flood Hub team, I focused on designing a highly adaptable interface that successfully serves diverse user segments, balancing the needs of end-users experiencing a flood with the specialized requirements of experts like NGOs and researchers. A core challenge of the design work involved improving different types of data visualization on the map. This required designing flexible viewing options that allowed users to customize data combinations based on their specific needs, while respecting technical constraints and ensuring an intuitive view customization experience